Originally published on speedscale.com.
A few years ago I was on call during the Super Bowl. At the time I was working for an observability vendor and one of our customers had an outage caused by a surge in user traffic. But our monitoring system didn’t have enough data to know what went wrong and I sat on a call for 2 hours painfully listening to them spinning up more servers and trying to catch up with the user load. I’m sure you know how that ended, they got the new servers online too late and that night everyone got off the web conference pretty frustrated.
After that experience I told myself I wanted to try to replicate these production conditions every release. So a few years ago I started working on the idea of traffic replay to reproduce conditions and scale up for the inevitable spikes.
It always starts with capturing live data. To capture network traffic and analyze traffic patterns, you need the right packet capture tools. Yes, you can build test scenarios from examples, create scripts from schemas or specifications. But there is simply no substitute for capturing packets and getting the real data about how a system works. This is the first blog in a 3-part series:
- How to build a traffic capture system (you’re here)
- How to build a traffic transform system
- How to build a traffic replay system
In this post, we’ll cover the foundation: how to capture traffic from a live system without bringing it to its knees.
Before you vibecode, consider your other tools
It’s always a good thought exercise to ask yourself the question: “Do I need to do this?” I don’t mean just because the boss asked, but is this a good idea, and is it already solved some other way? Well capturing traffic has a lot of benefits - you can get an idea of how customers use your service and visibility into how things really work. But if you have some observability tools like Datadog, Grafana, Dynatrace, New Relic, Jaeger, etc. you might already have the traffic capture data you need.
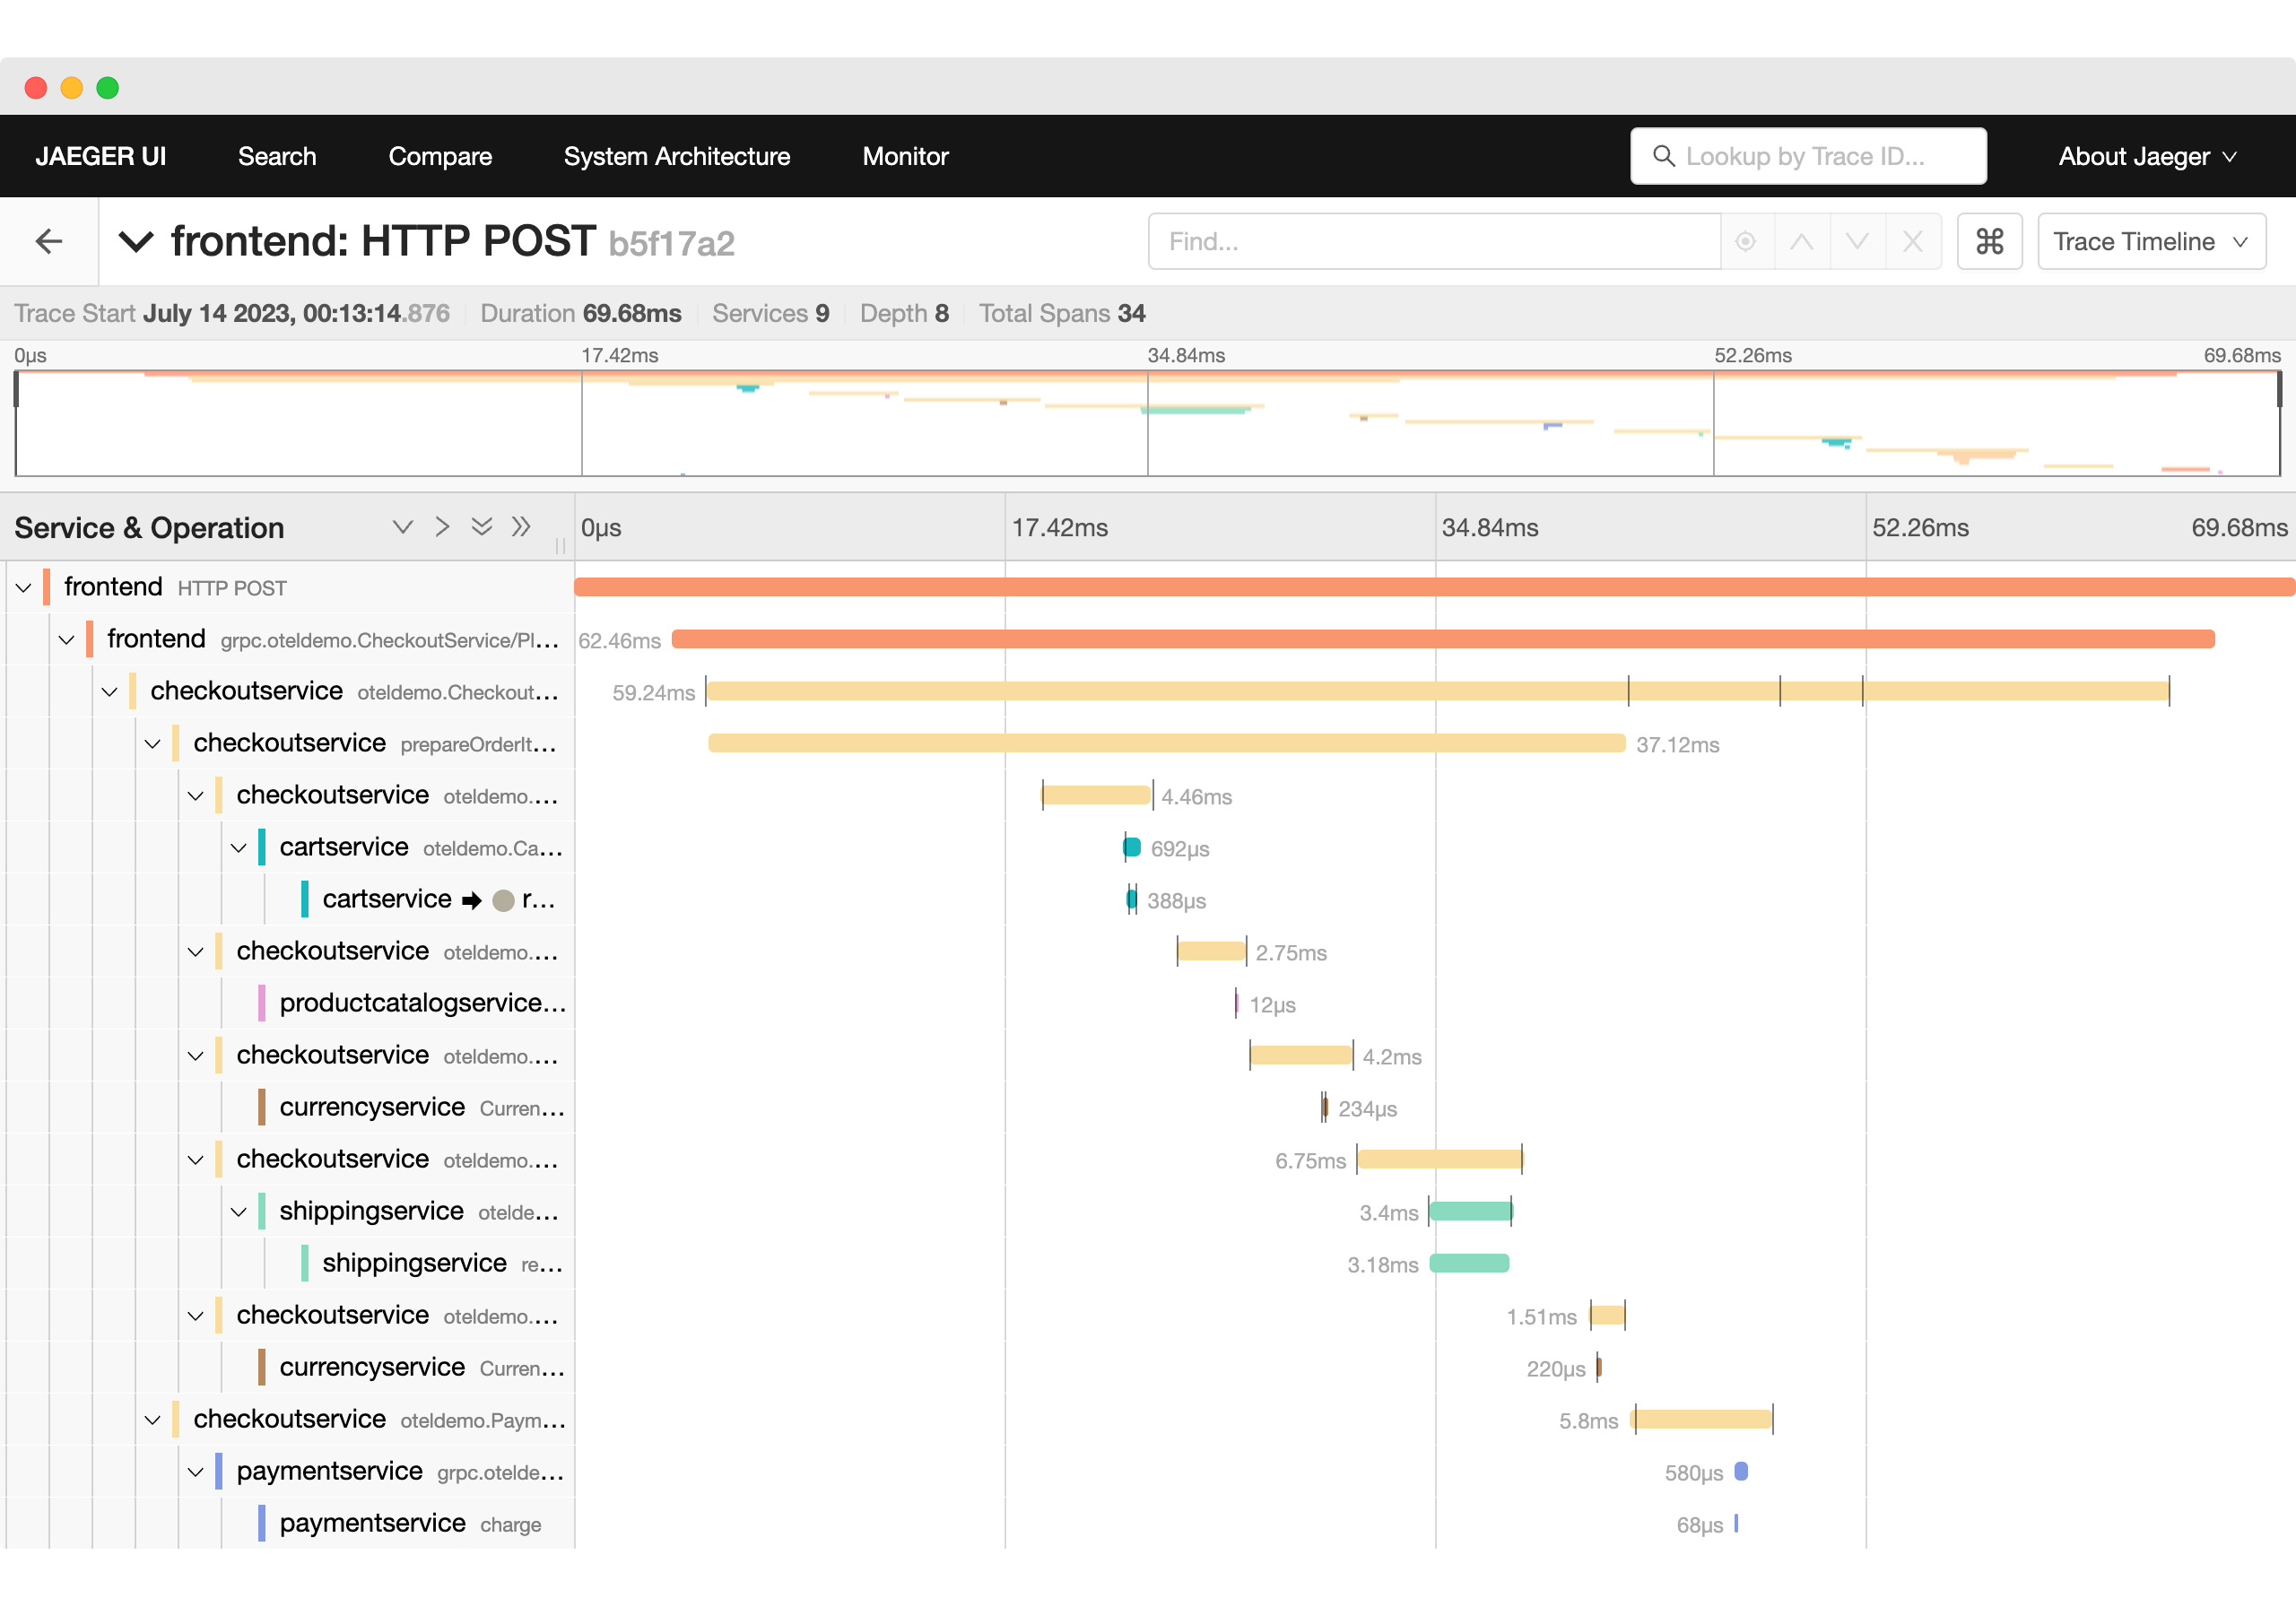 Source: Trace-based Testing the OpenTelemetry Demo
Unfortunately the typical observability systems don’t have the right kind of data. Many of them are designed to collect metrics (cpu, latency, etc.), traces (like a call tree to /login endpoint) and logs (STDOUT). In order to deal with the high throughput of most applications, data is aggregated, sampled, and really interesting stuff like the payloads of messages are removed.
Plan out your build
Since you definitely want to implement traffic capture, and you can’t use the observability tools, you need to plan out your high level requirements:
| Requirement | Decision |
|---|---|
| Overhead (latency) | Less than 5ms latency added |
| Overhead (compute) | Less than 10% CPU, 32MB RAM |
| Environment | VMs, Containers, Kubernetes, Lambdas |
| Depth | Just inbound or inbound + outbound traffic |
| Encryption | Only work with clear or decrypt TLS data |
| Protocols | HTTP/S, REST, gRPC, GraphQL, Databases, Kafka |
| Data Format | Postman Collection, protobuf, markdown |
| Throughput | ___ req per second, ___ bytes per second |
You may find a few new requirements of your own but this is already plenty to consider and we’ll go through the Capture part as well as the Storage part of the problem.
Traffic Capture Methods
When you need to capture network traffic and analyze packets, you have several approaches. The most common pattern for HTTP/S network capture is to use a proxy, but the most common way to perform overall TCP packet capture is to use packet capture tools like tcpdump. If you don’t have any tools at all, just log the data to STDOUT and reassemble on the other side. We’ll dive into a variety of options below.
There are a few common kinds of proxies that are used for traffic capture:
- Reverse Proxy: Unlike what you might guess, the reverse proxy actually sits in front of the app (like a load balancer) and forwards to the appropriate backend. You can install a reverse proxy to gather inbound traffic. Some popular reverse proxies include
nginx,apache httpd, orcaddythere are truly tons of options. You might be able to start with one of these or implement your own fairly easily.
Example nginx reverse proxy configuration:
location / {
proxy_pass http://localhost:3000;
proxy_set_header Host $host;
proxy_set_header X-Real-IP $remote_addr;
}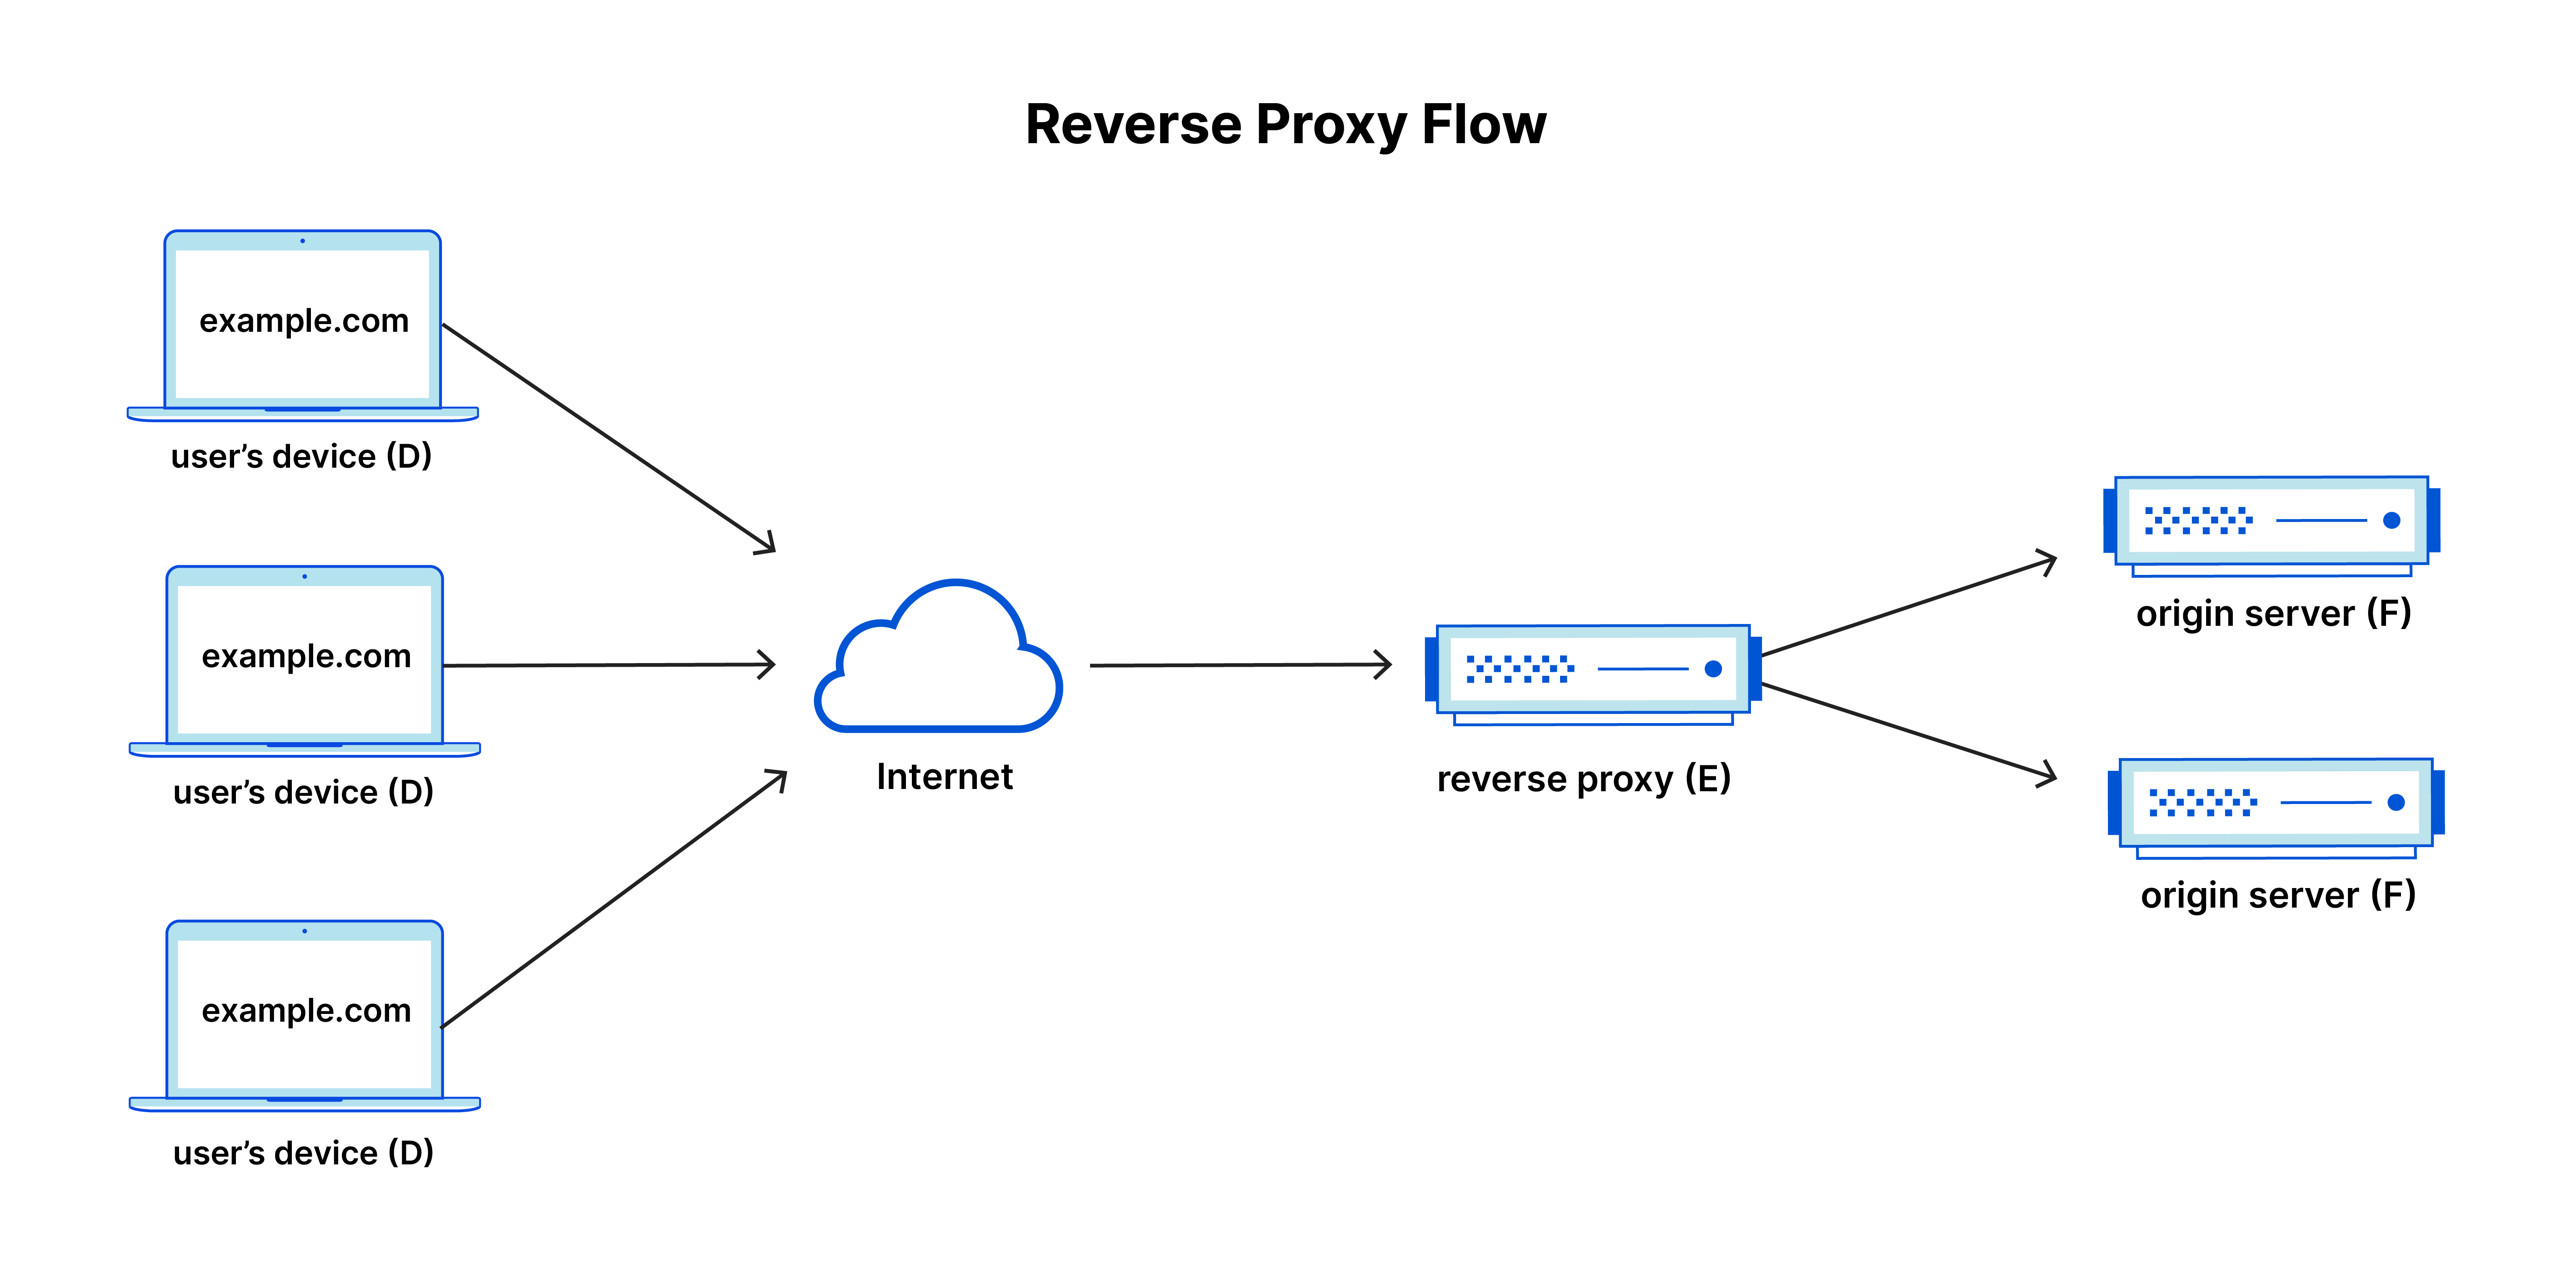 Source: What is a reverse proxy? | Proxy servers explained
- Forward Proxy: The forward proxy is used to request a backend for another client. You can often configure this with environment variables like
HTTP_PROXY,HTTPS_PROXYorSOCKS_PROXY. Note that SOCKS works with anything on a socket which is useful for things like database data, but the HTTP/S proxy is simpler. Examples includesquid,apache atsand others.
Example setting up a forward proxy for a Go application:
export HTTP_PROXY=http://proxy.example.com:8080
export HTTPS_PROXY=http://proxy.example.com:8080
go run main.go- Transparent Proxy: The transparent proxy will capture data without the application knowing. This can be a huge advantage, and in cloud environments like Kubernetes it’s how a service mesh like
istioorlinkerdcan get visibility into data without having to change out the endpoints. While powerful, these require more effort to implement.
But a proxy is not the only option, there are a few other alternatives that don’t work at the TCP socket level but get data from the OS itself. A couple of examples include:
- tcpdump: This powerful packet capture tool can be used to capture packets and save network traffic to a pcap (packet capture) file. It’s easy to install on Linux or Mac, and you can download Wireshark to analyze traffic in the packet capture file.
Example tcpdump command for packet capture:
tcpdump -i eth0 -w traffic.pcap 'port 8080'
# Creates a pcap file you can open in Wireshark to analyze traffic- Application Logging: Sometimes the simplest approach is to add structured logging directly in your application code to capture requests and responses.
Example Go middleware for traffic capture:
func CaptureMiddleware(next http.Handler) http.Handler {
    return http.HandlerFunc(func(w http.ResponseWriter, r *http.Request) {
        log.Printf(`{"method":"%s","path":"%s","remote_addr":"%s"}`,
            r.Method, r.URL.Path, r.RemoteAddr)
        next.ServeHTTP(w, r)
    })
}- eBPF: Another Linux specific tool, eBPF enables traffic capture directly from the kernel to trace network and process data. There are a number of pre-built applications, although there are also gotchas for specific languages. Read more from our blog: eBPF go design notes
With the ubiquity of AI coding tools like Cursor, Claude Code and GitHub Copilot, it’s easier than ever to experiment with traffic capture approaches. It’s worth it to run a few experiments with proxy servers and Linux tools to understand what options are available for traffic capture.
Packet Capture Best Practices
When you capture network traffic, consider these best practices to ensure efficient and effective packet capture:
-
Capture file size limits: Set maximum file size limits to prevent filling disk space. Tools like tcpdump support the
-Cflag to specify maximum size per capture file, automatically rotating to new files when the limit is reached. -
Capture packets with filters: Use capture expressions to limit what packets are captured, reducing file size and improving performance. For example, filter by port, IP address, or protocol to focus on relevant traffic.
-
Administrator privileges: Most packet capture tools require administrator privileges or root access to capture data at the interface level. This is necessary to access the network interface in promiscuous mode.
-
Analyze traffic regularly: Don’t just capture packets—use tools like Wireshark to analyze traffic patterns and identify issues. Regular analysis helps you understand traffic patterns and spot anomalies.
Example with file rotation and maximum file size:
# Packet capture with 100MB maximum file size, rotating files
tcpdump -i eth0 -C 100 -w capture.pcap 'port 8080'
This creates multiple pcap files (capture.pcap, capture.pcap1, capture.pcap2, etc.) as each file reaches the maximum size, ensuring you don’t run out of disk space while maintaining continuous traffic capture.
Technical Considerations
Managing traffic capture overhead
Overhead can be measured in different ways: latency and infrastructure. The worst kind of overhead is latency, you don’t want to add some kind of agent that causes the system to slow down. While you can choose to buy and deploy more compute, you can’t buy more milliseconds. So the most common way to deal with the overhead is to have the agent do the minimal amount of data processing and offload to another process. Another good reference for this comes from the Open Telemetry docs:
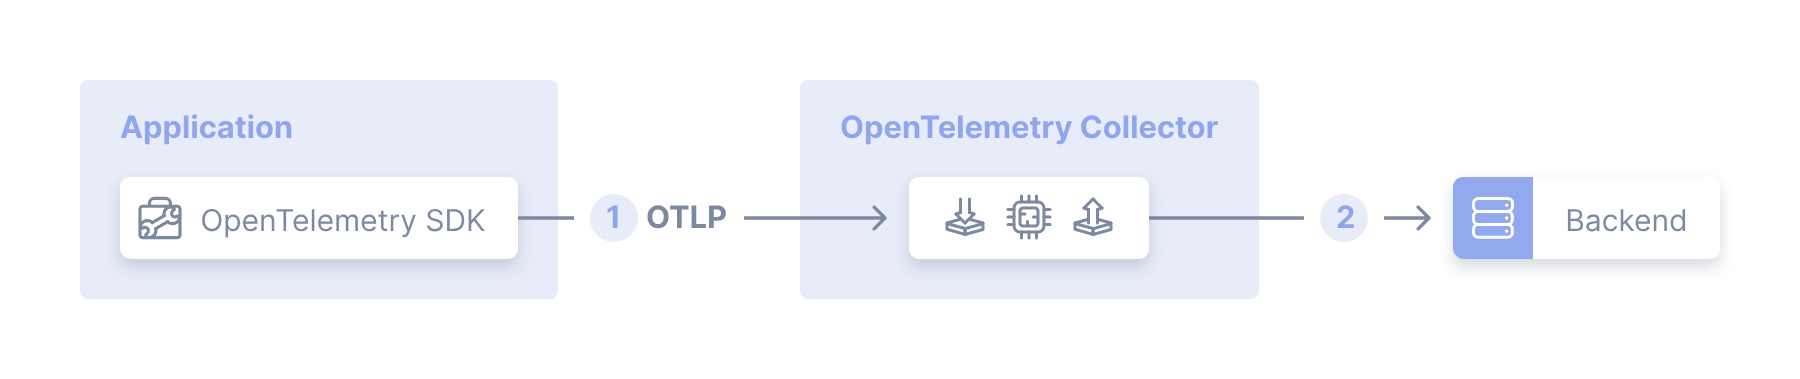 Source: OTEL Agent
This means in addition to the agent you need to create a collector that is ready to receive and process the traffic and send to storage.
Tip: Start measuring a baseline of performance and what it looks like with and without the agent, and under various load conditions.
Running in your Infrastructure
Well it’s somewhat obvious that you need to run your traffic capture system properly in your own staging and production environment. While lots of tools are designed for use locally, you need to consider how you’re deploy your agents and collectors across your ecosystem. Consider the kind of infrastructure you are using and how you will deploy the agent and connect it to running applications:
- Virtual Machines: You may need to install the agent into your machine image so it’s available locally or push it with a deployment tool. You’ll also need to ship a config file so the agents know how to send data to the collector.
- Containers: These are designed to not be updated once they have been built, so you may need to build the agent into your code or onto the image if you are not deploying onto Kubernetes.
- Kubernetes: Fortunately you can deploy a proxy using the sidecar pattern, and many of the
eBPFsolutions support running on K8S (make sure to check your Linux distribution to make sure it’s supported). - Lambdas / Functions: Because these run in a walled garden it’s often more difficult to get the capture system installed from the outside, you may need to modify your code and push traffic samples to your collector.
Note: Make sure to plan out how the collector will be deployed and discovered by all of the agents and fit in with your infrastructure.
Inbound and Outbound Network Traffic
Most applications are broken into components or services and have various backend downstream systems. If you want to be able to test each component individually, you want to implement outbound traffic capture as well. This gives you visibility into all your dependencies and lets you pick and choose if you want to mock out something else. This is where the complexity goes up a notch however because while most apps only talk HTTP/S inbound, they use all kinds of protocols for outbound like: postgres, mysql, kafka or redis which each come with their own wire protocol format. Yay!
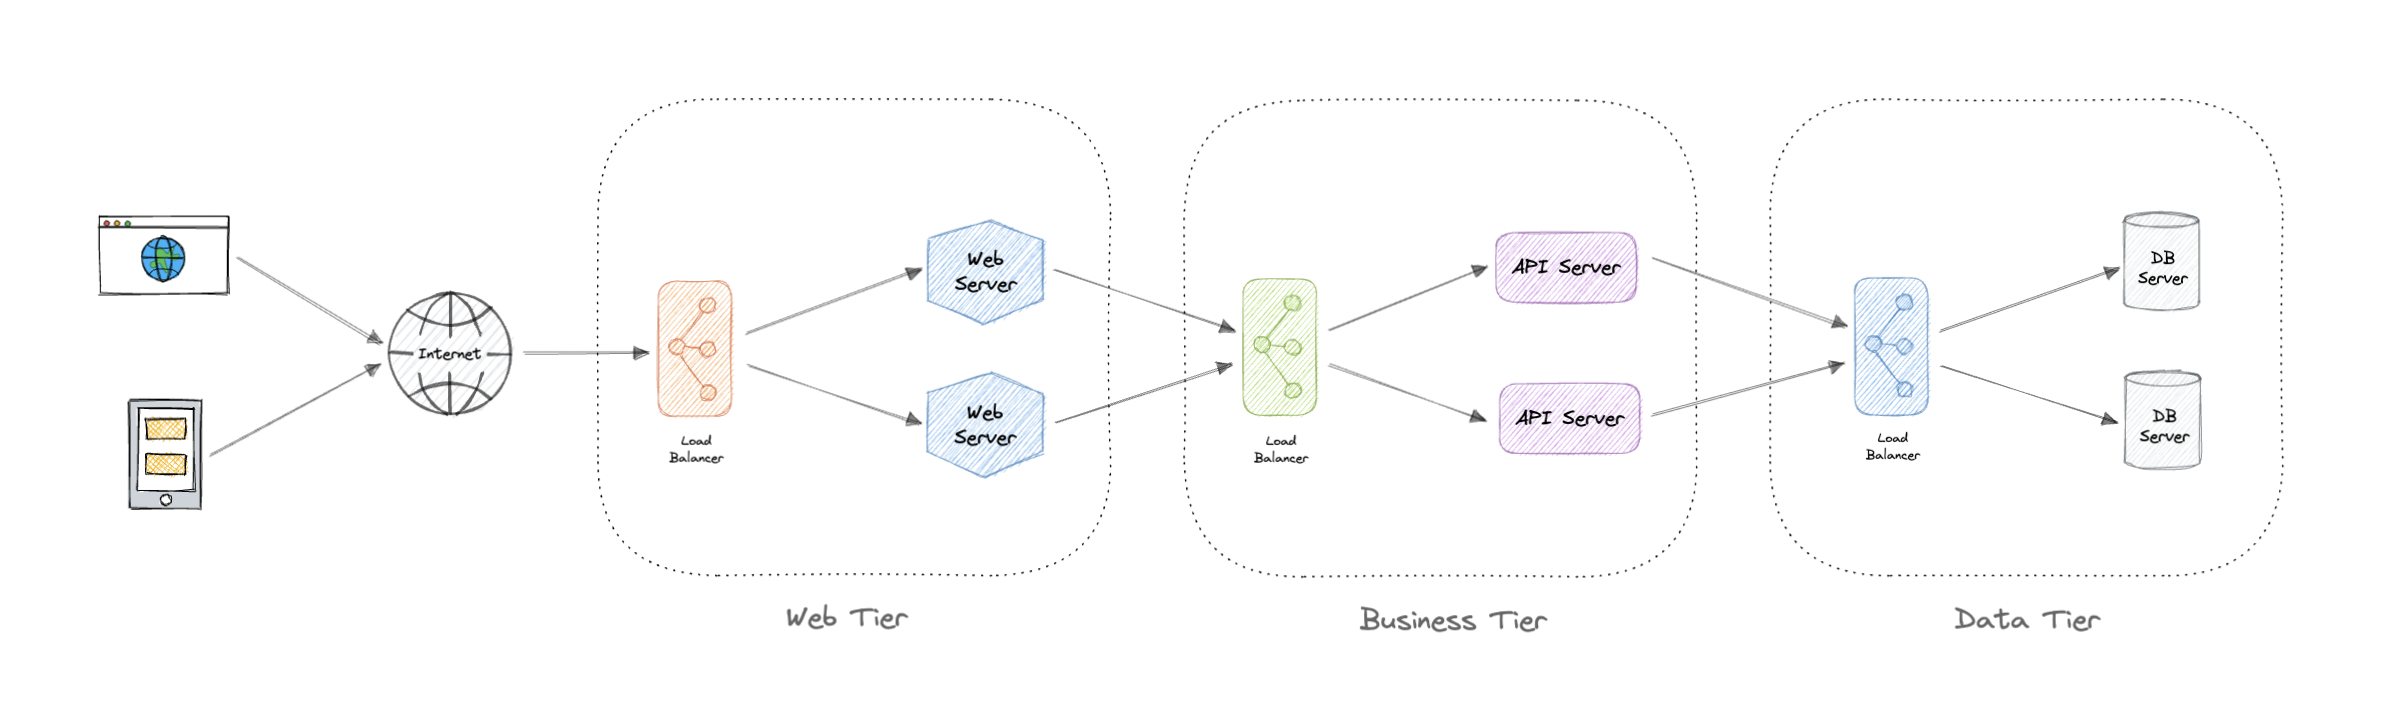 Source: System Design by Karan Pratap Singh
At a minimum you want to capture the outbound HTTP/S traffic so you can see calls to cloud services, SaaS endpoints or potentially even other APIs from within your company.
Dealing with encryption when you capture traffic
It’s possible that the inbound traffic is decrypted by the time it gets to your app. If so that’s great because you can use something like tcpdump for packet capture or a reverse proxy and get visibility into the traffic right away. But a lot of the interesting data is encrypted with TLS certificates over HTTP/S for example. Fortunately there are solutions for dealing with this and there are a few common options:
- mitmproxy: When using a proxy you can run the traffic through mitmproxy which can decrypt the traffic on the fly. It means “man in the middle” and can present one certificate to your client (you will need to trust this certificate) and then make the live call to the backend. Check it out, this is a cool tool.
- Wireshark: In addition to displaying packet capture data from
tcpdump, you can download Wireshark to analyze traffic and decrypt recorded traffic in pcap files. You can put the private keys into Wireshark and decrypt recorded traffic. This works great if you control the backend, but can’t be applied for third party services outside of your control. - eBPF uprobes: By using eBPF uprobes (user probes) you can instrument
SSL_readandSSL_writefrom libraries like OpenSSL so that you’re only accessing the data when it’s unencrypted inside the code. It works great but depends on the TLS library.
Handling various protocols
Remember that point about capturing the outbound calls? It may be useful to see your SQL statement and what Result Set was returned, in which case your traffic capture system may need support for postgres or mysql protocol. As you are designing your traffic capture system, think about the technologies used by your team and which ones are the most important. Start with the basics: HTTP/S transport and the most common Content Types. Fortunately you can spy this by looking at the Content-Type header. Mozilla has a handy list of the Common media types such as our friends:
| Extension | Kind of Document | MIME Type |
|---|---|---|
| .bin | Any kind of binary data | application/octet-stream |
| .json | JSON format | application/json |
| .txt | Text, (generally ASCII or ISO 8859-n) | text/plain |
| .xml | XML | application/xml (as of RFC 7303) |
But don’t be fooled, technologies like GraphQL and gRPC are also very common for HTTP/S traffic. In addition to handling the HTTP/S transport (and decrypting), you need to process and store the payloads as well.
Tip: Payloads are often compressed with the
Content-Encodingheader, so pay attention to that and you must uncompress before showing to your user.
Data Storage & Format
Traffic capture portability and managing capture size
Now that your traffic has been captured, decrypted and uncompressed, you’re going to want a common way to store and view the data. By focusing on just a single technology like HTTP/S you may be able to advantage of existing formats such as the Postman Collection Format. However, if you want to handle multiple protocols you may need to design your own schema using swagger or protobuf for consistently marshalling and unmarshalling your traffic capture data.
One of the things we learned at Speedscale is that by using markdown format it’s easier for the AI coding agents to understand. So while we used protobuf for our internal format, we convert to markdown before saving into a repo so that developers get the advantage of using their coding assistant. Here’s an example, it looks a lot like HTTP wire protocol format:
### REQUEST (TEST) ###
GET http://localhost:4143:8080/ HTTP/1.1
Accept: */*
Host: localhost:4143
User-Agent: curl/8.7.1

### RESPONSE ###
Content-Type: application/json
Date: Wed, 23 Jul 2025 21:13:07 GMT

{
  "/": "Shows this list of available endpoints",
  "/api/latest-launch": "Get the latest SpaceX launch",
  "/api/numbers": "Get a random math fact",
  "/api/rocket": "Get a specific rocket by ID (use ?id=[rocket_id])",
  "/api/rockets": "Get a list of all SpaceX rockets"
}
Source: GitHub Outerspace Demo
Of course this is just an example of a single file, so for easier storage you can combine multiple files together and compress them, or write out each file individually. The advantage of writing out single files is that reading one of them is very simple. But the disadvantage is that in a busy system you can have millions of files and any kind of scan of the index will take too long.
Traffic Capture Scalability
You’ve got agents pouring traffic into your collector(s) and need to make sure that it can keep up. There are well known patterns for dealing with spiky load scenarios in traffic capture systems:
-
Auto-Scale: Configure your collector with an autoscaler so when it starts to get overloaded that another instance will spin up. You need to ensure everything is stateless and it’s OK for the data to be written out-of-order when you fan out.
-
Queue-Based Buffering: Instead of writing directly from the agents to the collector, put a message queue in between to absorb traffic spikes. Popular options include:
- Apache Kafka: High-throughput distributed streaming, great for large-scale systems
- RabbitMQ: Lightweight and easy to set up, supports multiple protocols (AMQP, MQTT, STOMP)
- NATS: Cloud-native messaging with focus on simplicity and performance
- Redis Streams: If you’re already using Redis, streams provide built-in persistence and consumer groups
- Cloud options: AWS SQS, Google Pub/Sub, Azure Service Bus
-
Sampling: When traffic volume exceeds capacity, implement intelligent sampling strategies:
- Random sampling (capture 10% of all traffic)
- Rate-based sampling (1 request per second per endpoint)
- Priority sampling (always capture errors, sample successful requests)
-
Edge Processing: Process and compress data at the agent level before sending to reduce bandwidth and storage requirements.
-
Sharding: Distribute traffic across multiple collectors based on service name, endpoint path, or consistent hashing to spread the load.
Cloud Storage Options
For storing large volumes of traffic capture data, leverage cloud-native services optimized for ingestion and long-term storage:
AWS:
- S3: Object storage for captured traffic files, supports high throughput writes and lifecycle policies
- Kinesis Data Streams: Real-time ingestion pipeline from agents to storage
- DynamoDB: Fast indexed access to traffic metadata with high write throughput
Google Cloud:
- Cloud Storage: Similar to S3, with strong consistency and automatic compression
- Pub/Sub: Message queue for buffering traffic data between agents and storage
- BigQuery: Store and query massive traffic datasets with SQL
Azure:
- Blob Storage: Scalable object storage with hot/cool/archive tiers
- Event Hubs: High-throughput streaming ingestion
- Cosmos DB: Globally distributed database for traffic metadata
What is just as important as the architecture is that you size the system based on what you know from your observability stack, and validate it in your non-prod environment. It should be easy to push sample data through and calculate the number of messages per minute or total volume of bytes per minute. Remember to mix up message sizes and volumes.
Frequently Asked Questions
How do I capture network traffic?
To capture network traffic, you can use packet capture tools like tcpdump to save traffic to a pcap file, or use proxy servers (reverse proxy, forward proxy, or transparent proxy) to intercept and record traffic. You’ll need administrator privileges to capture packets at the network interface level.
What is a pcap file?
A pcap file (packet capture file) is a standard file format for storing captured network traffic. Tools like tcpdump create pcap files, and you can download Wireshark to analyze traffic in these capture files. The pcap format preserves all packet data including headers and payloads.
Do I need administrator privileges to capture packets?
Yes, most packet capture tools require administrator privileges or root access to capture this kind of data. This is because capturing packets requires access to the network interface in promiscuous mode, which allows the interface to capture all traffic on the network segment.
What is the maximum file size for traffic capture?
The maximum file size depends on your tool configuration and available disk space. Tools like tcpdump support the -C flag to set a maximum file size per packet capture file (e.g., 100MB), automatically rotating to new files when the limit is reached. This prevents filling disk space while maintaining continuous packet capture.
Conclusion
Building a traffic capture system is not for the faint of heart. Fortunately you can benefit from other teams that have gone down this path before, either reading about how they built similar systems or even utilizing some of their open source components:
| Platform | Example |
|---|---|
| Netflix PollyJS | Record, Replay, and Stub HTTP Interactions |
| Uber Kaptre (Capture) | Data Testing Strategies |
| Kubeshark | Network observability platform for Kubernetes |
| GoReplay | buger/goreplay |
| Sn126 Diffy | opendiffy/diffy |
| Speedscale proxymock | Observability into API and database payloads |
Now that we’ve got all this captured traffic, I’ll show you how to make it useful in the next blog in this series:
If you have more questions about traffic capture, feel free to join our free Community and connect with other teams building out traffic capture and replay systems.